Ready to Build Something That Lasts?
We meet companies where they are, whether they’re navigating rapid growth, a transaction, a leadership gap, or an operational rebuild. Let’s talk about what you are solving for.

The CFO job description has rewritten itself, and most finance functions haven’t caught up. The modern CFO is expected to forecast a business that changes quarterly, defend capital allocation in front of a board that wants scenarios rather than a single number, and do it with a team that has not grown proportionally to the complexity it is absorbing. None of that is achievable on judgment alone. It requires CFO technology and a finance tech stack that turns raw transactional data into decisions faster than the business changes.
Here is the uncomfortable part: most middle-market finance organizations do not have a stack. They have an accumulation. Tools were bought one problem at a time, by different people, in different years, and the seams between them are held together by exports, macros, and one analyst who knows how it all fits. That arrangement works right up until growth, an acquisition, or a lender question exposes it.
This guide covers how technology has changed the finance industry, which financial technology trends are actually reshaping the office of the CFO, how the layers of a modern finance tech stack fit together, where FP&A belongs in it, how to evaluate financial technology solutions without buying the demo, and what CFO AI transformation strategies look like when they are built to survive contact with a real close calendar.
Technology has changed the finance industry by moving the finance function through four distinct eras, recording what happened, reporting it faster, seeing it in real time, and now reasoning about what to do next. The practical consequence is that a finance team’s value has shifted from producing numbers to interpreting them. Producing the number is increasingly a solved problem. Knowing which number matters, and what the business should do about it, is not.
Four shifts matter more than technology itself.
The honest test of whether technology has changed your finance function: if your CEO asked for three scenarios on a new pricing model, could you produce them by Thursday, or would you need two weeks and a quiet analyst?
Set aside the vendor noise. Five financial technology trends are genuinely changing CFO technology decisions and how finance functions are built.
A functioning finance tech stack is not a list of financial technology solutions. It is a set of layers, each answering a different question, built on one shared data model with automation and controls running through all of them.
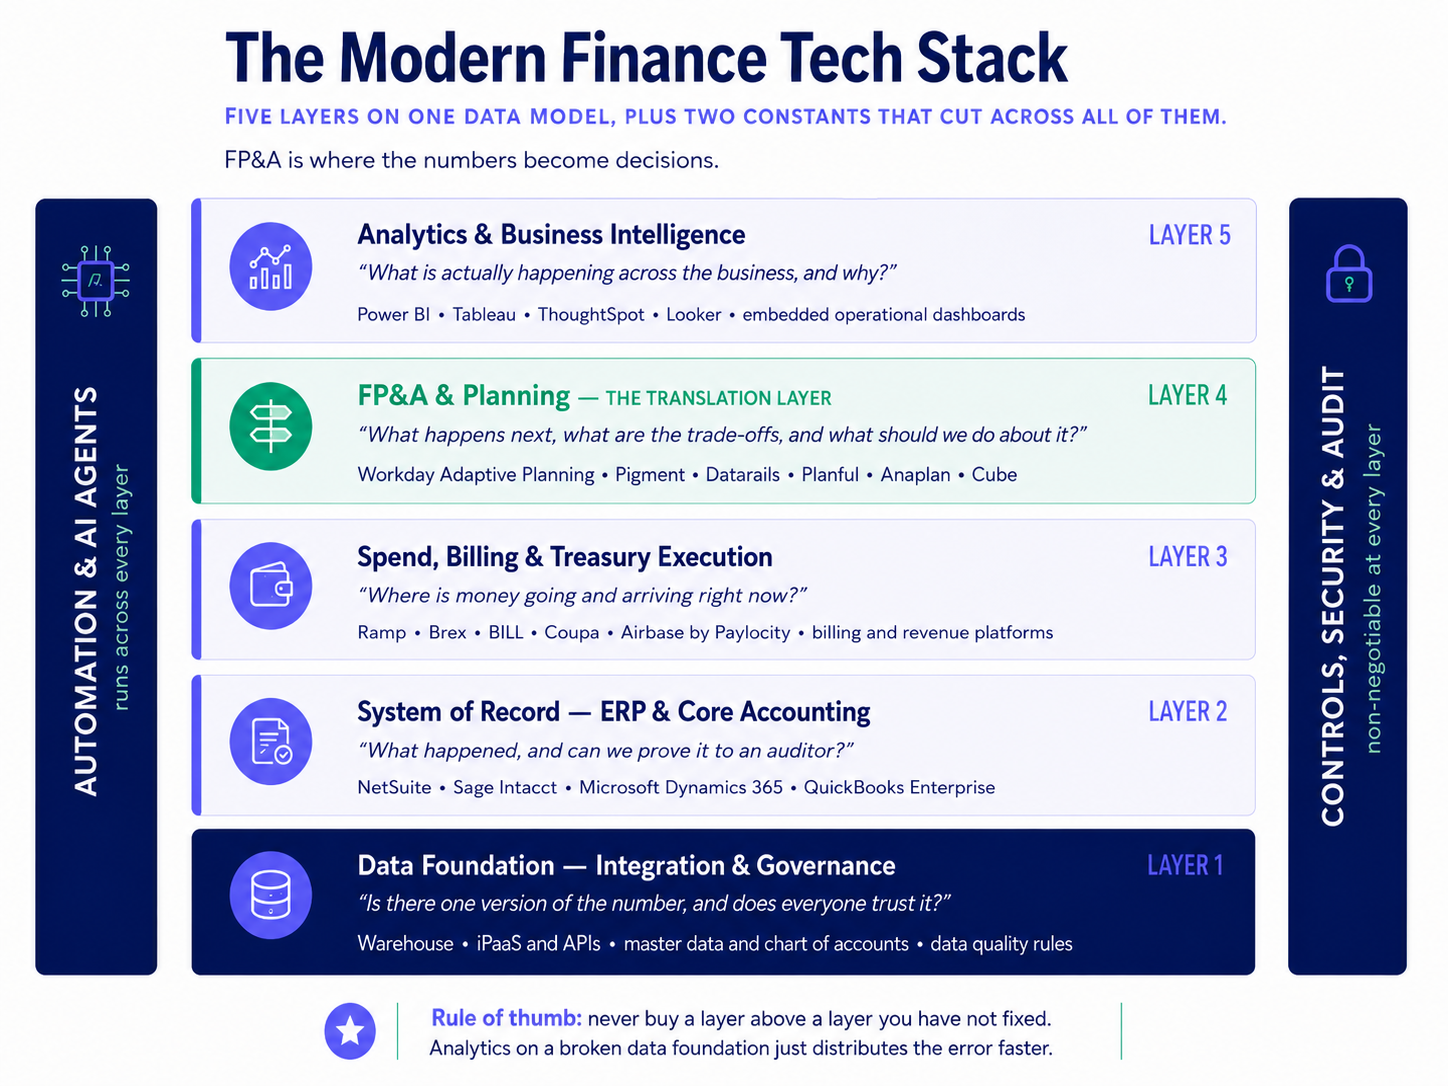
Figure 1: The five layers of a modern finance tech stack, with automation and controls running across all of them.
Layer 1 — Data Foundation. The warehouse, the integrations, the chart of accounts, the master data, and the rules that keep them clean. This is the least visible layer and the one that determines the ceiling on everything above it.
Layer 2 — System of record. The ERP or core accounting platform where transactions live, audit trails are created, and work like bank reconciliation, balance sheet account reconciliation, intercompany reconciliation, journal entry support, and account support must remain traceable. Its job is defensibility, not speed. NetSuite, Sage Intacct, Microsoft Dynamics 365, and QuickBooks Enterprise all serve this layer at different scales.
Layer 3 — Execution. Spend management, AP and bill pay, corporate cards, billing, and treasury. Platforms like Ramp, Brex, BILL, Coupa, and Airbase by Paylocity control policy at the moment money moves, not after the fact.
Layer 4 — FP&A and planning. This is where FP&A fits in the modern finance technology stack. Where actuals become forecasts, scenarios, and recommendations through work like budget-vs.-actual variance commentary, payroll and headcount variance, gross margin analysis, price-volume-mix analysis, 13-week cash flow forecasting, and scenario modeling. Covered in detail below, because this is the layer most often missing.
Layer 5 — Analytics and business intelligence. Dashboards, benchmarking, KPI templates, and self-serve exploration that let leaders see performance without asking finance for a report. Power BI, Tableau, ThoughtSpot, and Data Studio live here.
Running vertically through all five: automation and AI agents on one side, and controls, security, and audit on the other. Neither is a layer you buy once. Both are properties every layer either has or does not.
Rule of thumb: never buy a layer above one you haven’t fixed. Analytics on a broken data foundation do not create insight—they distribute the error faster and with more confidence.
FP&A fits in the modern finance technology stack at layer four, between the system of record and the decision. It is the translation layer. Everything below describes what happened; FP&A turns that history into a forecast, a set of trade-offs, and a recommendation someone can act on. It is not a reporting tool, and it is not an extension of the ERP, and treating it as either is the most common structural mistake in a middle-market finance stack.
Business intelligence describes. It answers what happened, with excellent visualization and near-zero opinion. FP&A commits. It answers what happens next, attaches assumptions to that answer, and accepts accountability when the assumptions turn out to be wrong. A dashboard that shows declining gross margin is BI. A model that shows what margin does under three pricing scenarios, and recommends one, is FP&A.
The ERP is optimized for defensibility: every entry traceable, every period locked. FP&A is optimized for iteration, where rebuilding a forecast on a new assumption in an afternoon is worth more than perfect ledger fidelity. Forcing one system to do both jobs creates a slow planning process and a loose ledger.
For most middle-market companies, adding a real planning platform — Workday Adaptive Planning, Pigment, Datarails, Planful, Anaplan, or Cube, depending on complexity and budget- produces more visible improvement than any other single addition to the stack, provided layers one and two are already sound.
Evaluate new finance technology for your business against a specific problem, not a category, and run every candidate through six gates in order, treating a failed gate as a stop rather than a caveat. Most disqualifications should happen before you ever take a demo, because the first three gates are about your organization rather than the vendor.
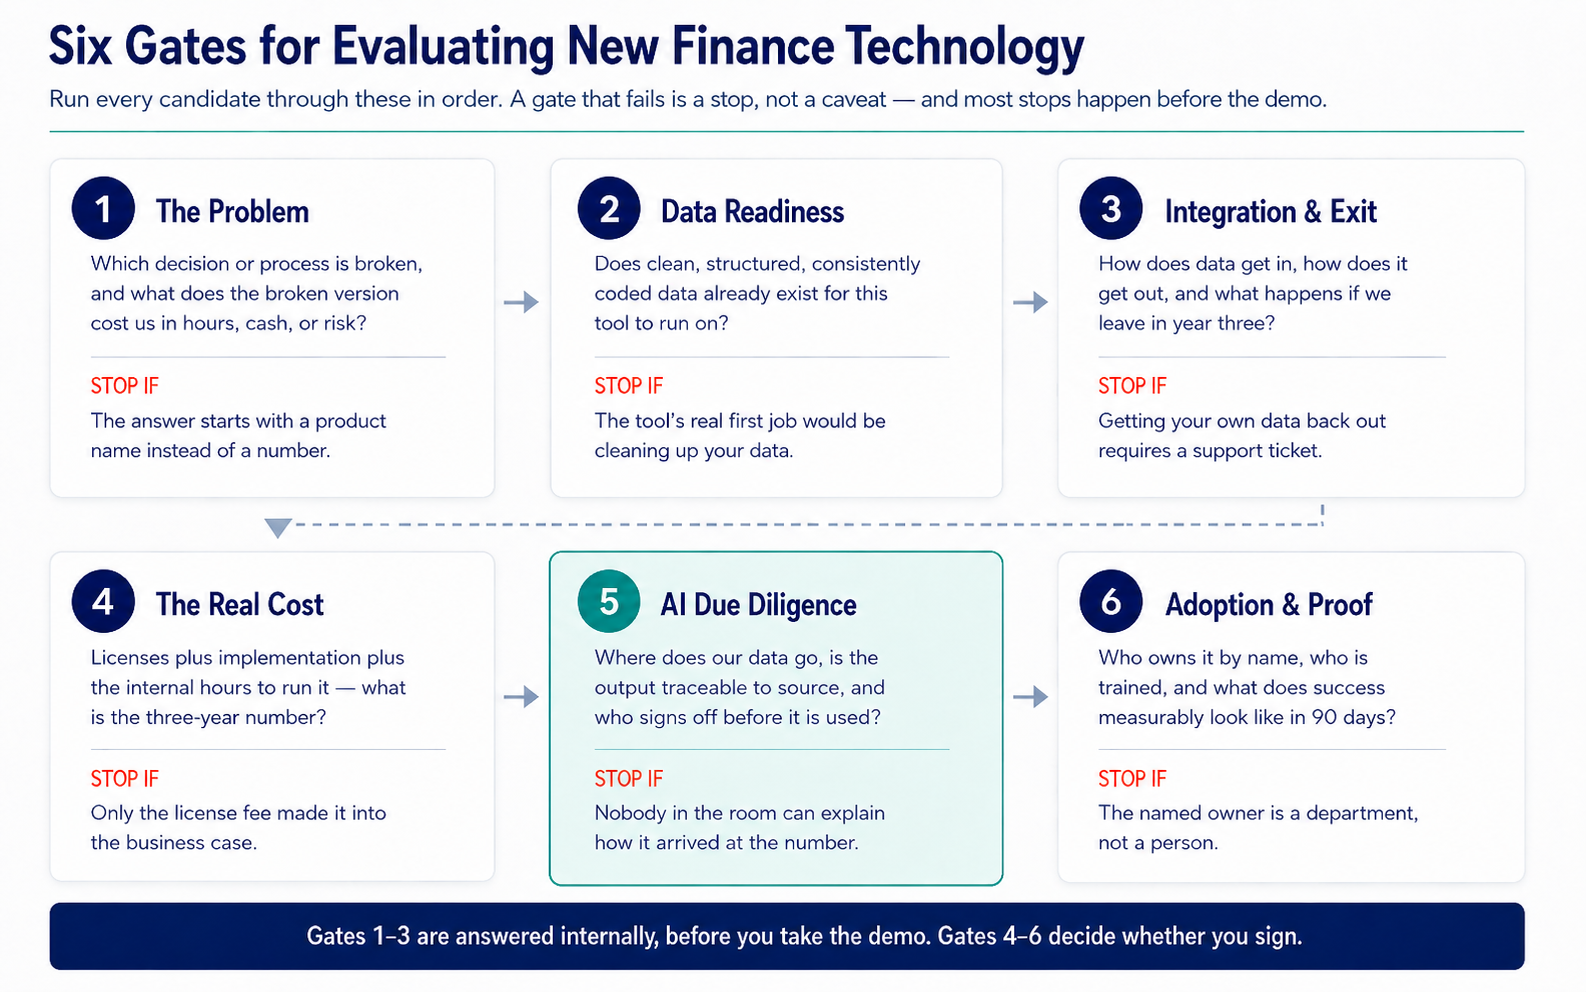
Figure 2: Six gates for evaluating financial technology solutions. Gates 1–3 are answered internally; gates 4–6 decide whether you sign.
The best first AI use cases in finance usually are not flashy. They are the repeatable, reviewable pieces of work that slow the team down every week, every close, and every reporting cycle.
The CFO AI transformation strategies that survive are sequenced by business risk, data readiness, and review discipline, not enthusiasm. Three waves, in order, with each one earning the right to the next.
Wave one — automate. Rules-based, high-volume, checkable work: reconciliations, invoice coding, exception flagging, journal entry support, monthly reporting packages, weekly cash reporting, and report assembly. Low judgment, high frequency, easy to verify. This wave builds credibility and buys the data hygiene that later waves depend on.
Wave two — augment. AI drafts and a human decides. Variance narratives, first-pass forecasts, scenario modeling, board-deck commentary, benchmarking research, bank information packets, diligence status memos, and covenant tracking. The output is a starting point that a qualified person edits, which is exactly the right posture while the organization learns where the tool is reliable and where it is not.
Wave three — delegate. Agents execute defined workflows end to end within explicit boundaries, escalating anything outside them. This may eventually include recurring cash reporting, KPI dashboard refreshes, data room request tracking, and controlled close support, but only where waves one and two have established both clean data and a functioning review process.
Five failure modes account for most of the waste.
If you are starting from an accumulation rather than a stack, sequence matters more than ambition.
| Window | Focus | What “done” looks like |
| Days 1–30 | Inventory and honesty | Every finance tool, its cost, its owner, and its actual usage on one page. Name and time the three processes that consume the most senior time. |
| Days 31–90 | Fix the foundation |
Chart of accounts rationalized, master data owned, integrations mapped. No new platform has been purchased yet. |
| Days 91–180 | Close the highest-value gap | Select one platform through the six gates and implement it with a named owner and a 90-day success measure. |
| Days 181–365 | Layer in AI, then prove it | Two or three AI use cases in reviewable form, with cycle time and accuracy baselines measured before and after. |
CFO technology is not a procurement exercise. It is an operating decision about how quickly your organization can turn what happened into what to do next. The finance functions pulling ahead are not the ones with the most tools. They are the ones whose finance tech stack layers fit together, whose data is trusted, and whose AI is deployed where it can be checked.
Build the foundation, add a real planning layer, evaluate against problems rather than categories, and sequence AI by risk. That stack compounds instead of accumulating.
At Growth Operators, we work alongside CFOs and executive teams to design, implement, and operate modern finance technology solutions that hold up under real conditions. Our fractional and interim CFOs, controllers, and finance leaders help companies:
Our proprietary nextLEVEL® framework provides a structured, repeatable process to assess your finance function, identify genuine technology needs, and execute transformation in the right order. It ensures you are not just adding tools; you are building a finance function that scales with the business.
Let’s talk about what your next-level finance tech stack could look like. Contact Growth Operators to start the conversation.
No matter where you are in the process, we can help you develop an Exit Readiness plan to maximize the value of your company and bring you to closing.
"*" indicates required fields